> ## Documentation Index
> Fetch the complete documentation index at: https://ngquct-fix-grid-viewport-after-reload.mintlify.site/llms.txt
> Use this file to discover all available pages before exploring further.
# Data Grid
> Sort, size, hide, highlight, chart, map and copy the rows a table or a query puts in the grid
Most of the grid's controls sit in the status bar beneath it. The view switcher is at the leading edge, the row count in the middle, then the columns, highlight, filter and page buttons at the trailing edge.
A narrow window trims that bar rather than cutting it off. The Columns and Filters buttons drop their titles first, and **First** and **Last** leave with them; the Query menu still carries all four page commands. Narrower still, the view switcher becomes a pull-down naming the current mode and rows-per-page moves into the page indicator's menu. Everything else keeps its place.
 ## Sorting
Click a header to cycle through the first direction, its opposite, and off. `Shift`-click a second header to sort by both. Sorting re-runs the query with a new `ORDER BY`, so it orders the whole table rather than the page in front of you.
**Sort direction** in [Settings > Data](/customization/data-settings) decides which way that first click goes. It is Ascending out of the box; set it to Descending to open on the newest rows and reach them in one click.
To sort on open, set **Default row sort** to **Primary key** or **First column**; out of the box the order is the server's. That order is marked with a dimmed arrow rather than the solid one a click leaves, so a table you have not sorted does not look sorted. Clicking the same header reverses it, and **Don't Sort** in the header menu returns to the server's order and stays there.
Sorting on a `BLOB`, `JSON`, or spatial column the server cannot order on fails the query. Sort on another column, or set **Default row sort** back to the engine's order.
## Filtering
The header menu carries two filters that answer different questions.
| Header menu item | What it filters |
| ----------------------------------------------- | ------------------------------------------------------------------------------------ |
| **Filter Values…**, or the funnel icon on hover | The rows already loaded, without a re-query |
| **Filter with column** | The whole table. It adds a row to the [filter bar](/features/filtering) and opens it |
**Filter Values…** lists every value in the column with its count, NULL and empty among them. Select the values to keep and click **Apply**. Filter several columns and a row has to match all of them; **Clear Value Filter** and **Clear All Value Filters** are on the same menu.
## Sorting
Click a header to cycle through the first direction, its opposite, and off. `Shift`-click a second header to sort by both. Sorting re-runs the query with a new `ORDER BY`, so it orders the whole table rather than the page in front of you.
**Sort direction** in [Settings > Data](/customization/data-settings) decides which way that first click goes. It is Ascending out of the box; set it to Descending to open on the newest rows and reach them in one click.
To sort on open, set **Default row sort** to **Primary key** or **First column**; out of the box the order is the server's. That order is marked with a dimmed arrow rather than the solid one a click leaves, so a table you have not sorted does not look sorted. Clicking the same header reverses it, and **Don't Sort** in the header menu returns to the server's order and stays there.
Sorting on a `BLOB`, `JSON`, or spatial column the server cannot order on fails the query. Sort on another column, or set **Default row sort** back to the engine's order.
## Filtering
The header menu carries two filters that answer different questions.
| Header menu item | What it filters |
| ----------------------------------------------- | ------------------------------------------------------------------------------------ |
| **Filter Values…**, or the funnel icon on hover | The rows already loaded, without a re-query |
| **Filter with column** | The whole table. It adds a row to the [filter bar](/features/filtering) and opens it |
**Filter Values…** lists every value in the column with its count, NULL and empty among them. Select the values to keep and click **Apply**. Filter several columns and a row has to match all of them; **Clear Value Filter** and **Clear All Value Filters** are on the same menu.

 A value filter lives as long as the result does: switching view mode or tab keeps it, replacing the result clears it. **Fetch All** keeps it and applies it to the rows it loads. Edit a cell so its row no longer matches and the row stays where it is. The filter runs again when rows arrive or leave, and when you change the filter or the column's display format.
## Highlighting
Right-click a cell and open **Highlight**. A color under **Rows Where status = “paid”** tints every row holding that value; a color under **Cells Where status = “paid”** tints only that cell. The palette marks the color a matching rule already uses, and **Remove Highlight** takes the rule away.
For anything other than an exact match, click the highlighter button in the status bar or choose **View > Highlight Rules**. A rule is a column, an operator from the [filter bar](/features/filtering), a value, a color, and **Row** or **Cell**. **Highlight Values…** in the header menu starts a rule on that column. A rule left without a value is dropped when the popover closes.
A value filter lives as long as the result does: switching view mode or tab keeps it, replacing the result clears it. **Fetch All** keeps it and applies it to the rows it loads. Edit a cell so its row no longer matches and the row stays where it is. The filter runs again when rows arrive or leave, and when you change the filter or the column's display format.
## Highlighting
Right-click a cell and open **Highlight**. A color under **Rows Where status = “paid”** tints every row holding that value; a color under **Cells Where status = “paid”** tints only that cell. The palette marks the color a matching rule already uses, and **Remove Highlight** takes the rule away.
For anything other than an exact match, click the highlighter button in the status bar or choose **View > Highlight Rules**. A rule is a column, an operator from the [filter bar](/features/filtering), a value, a color, and **Row** or **Cell**. **Highlight Values…** in the header menu starts a rule on that column. A rule left without a value is dropped when the popover closes.
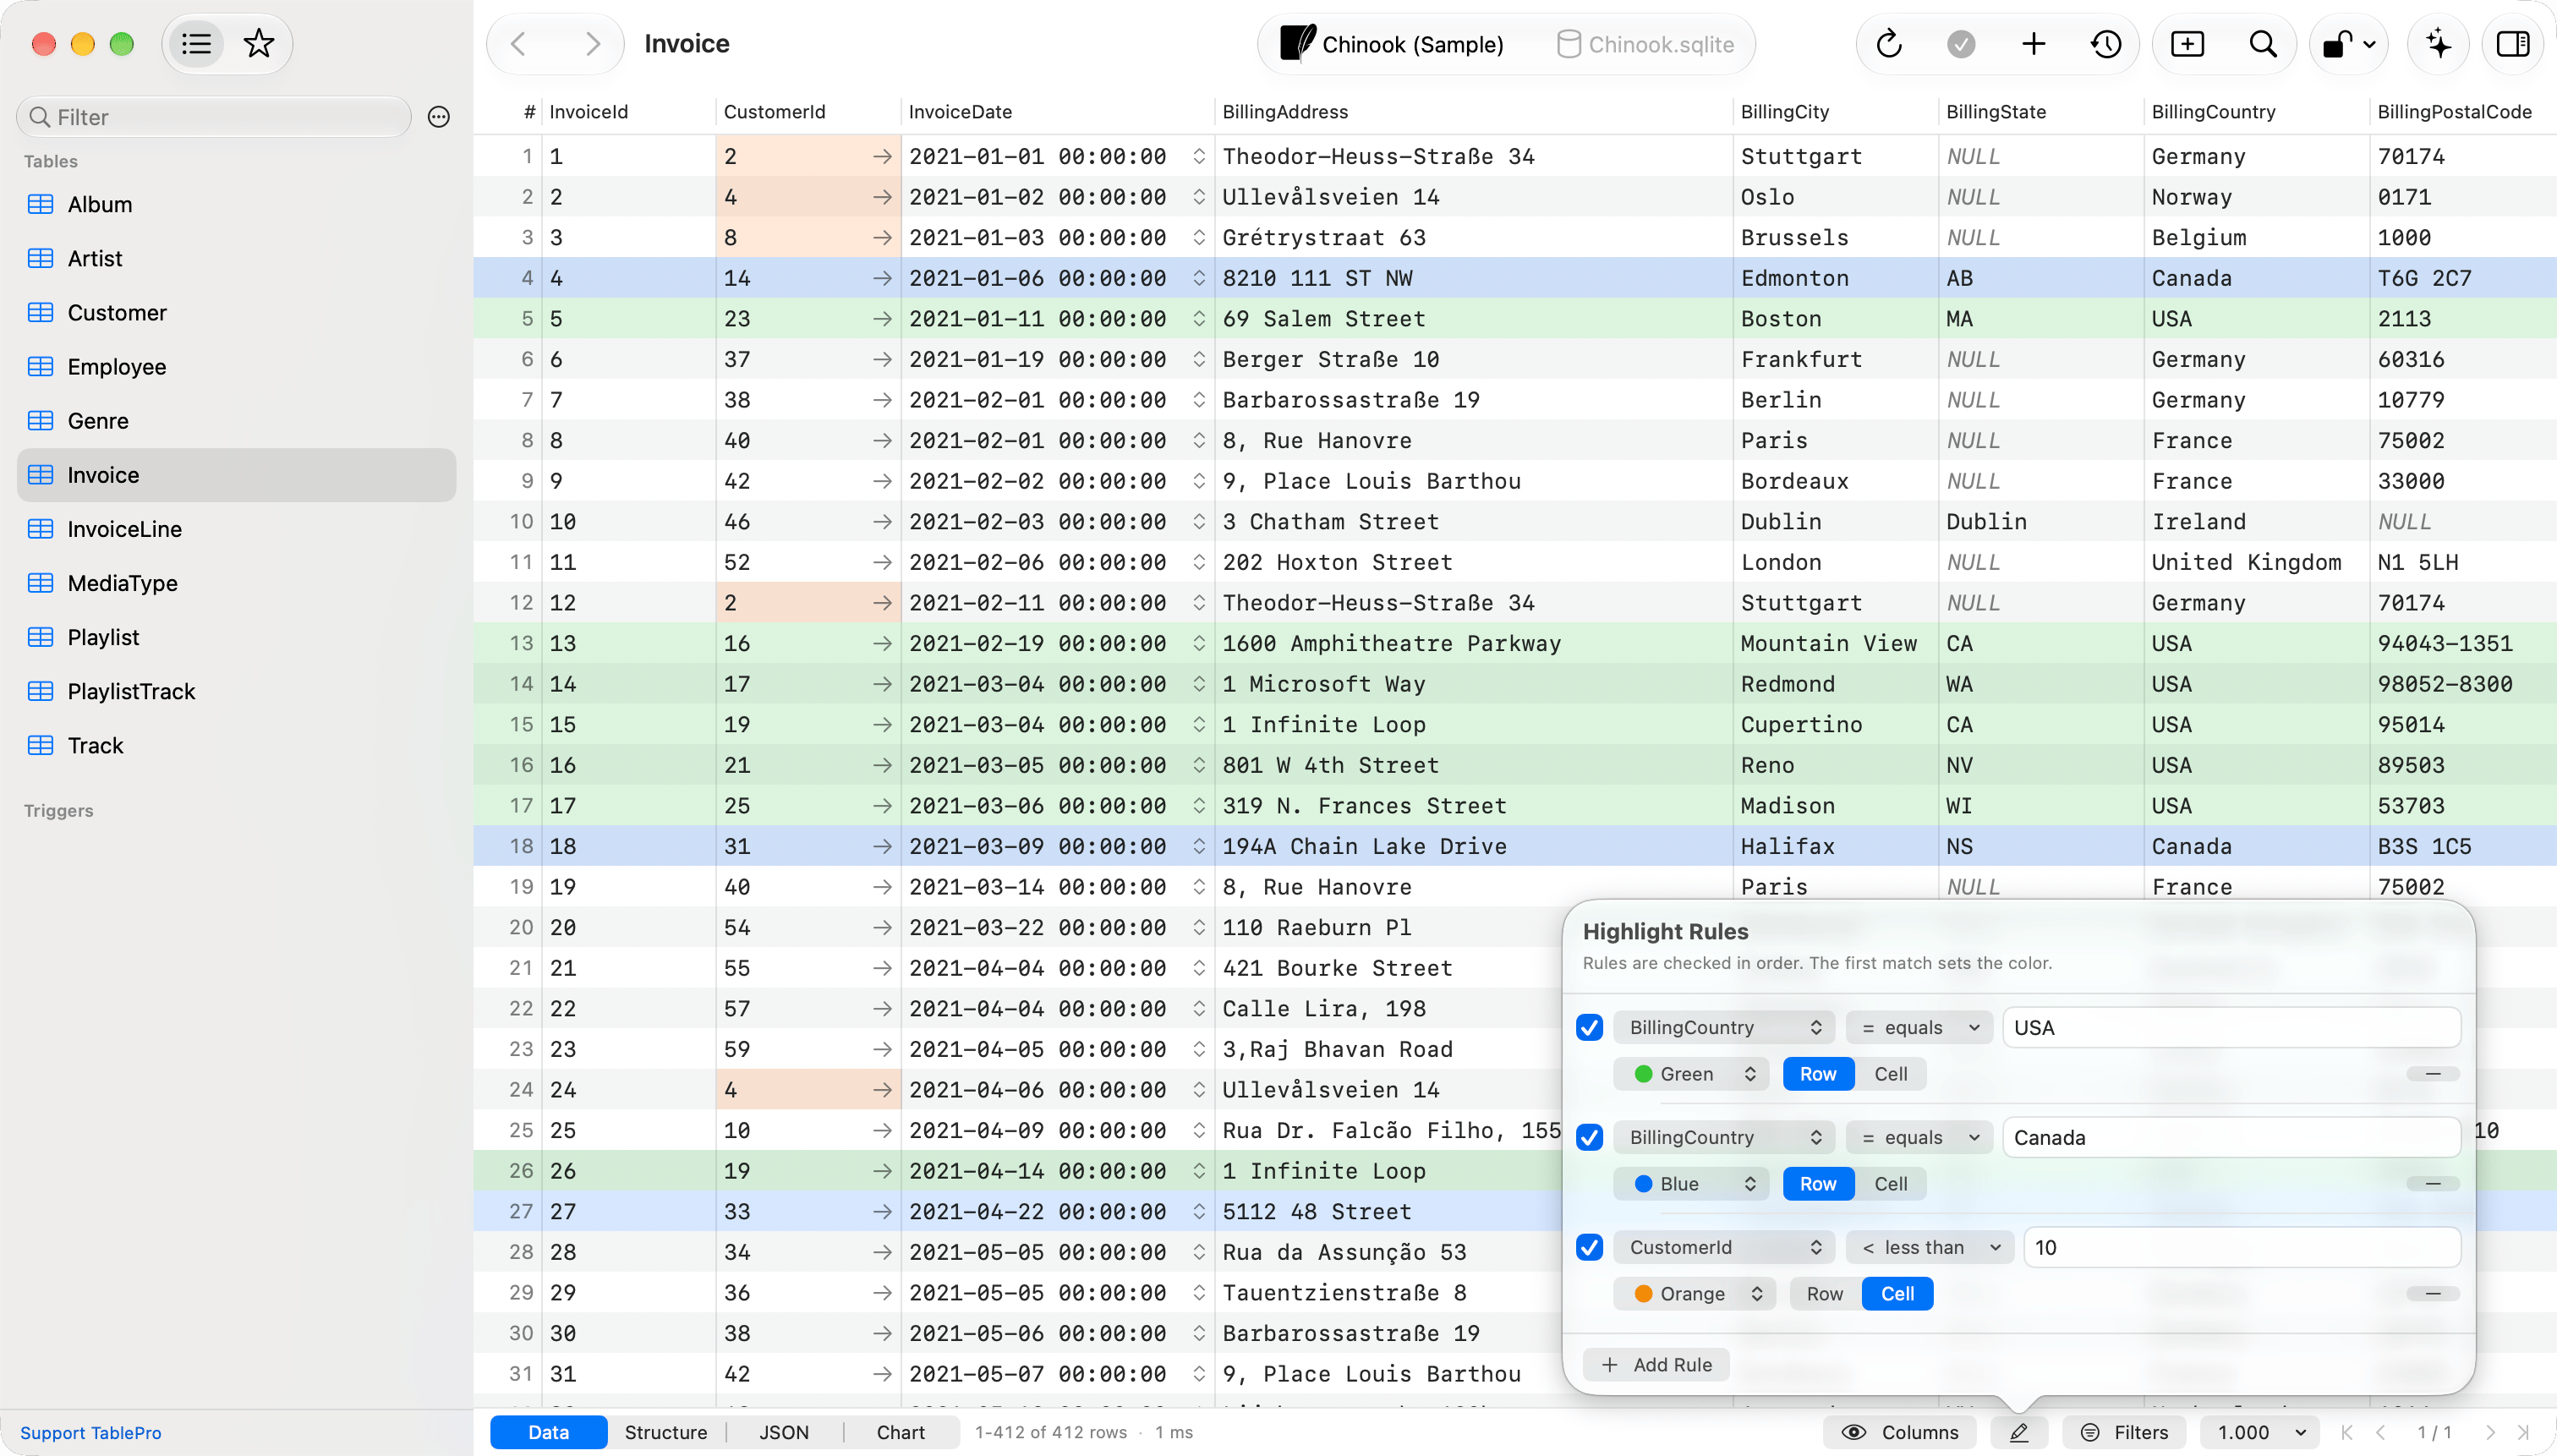
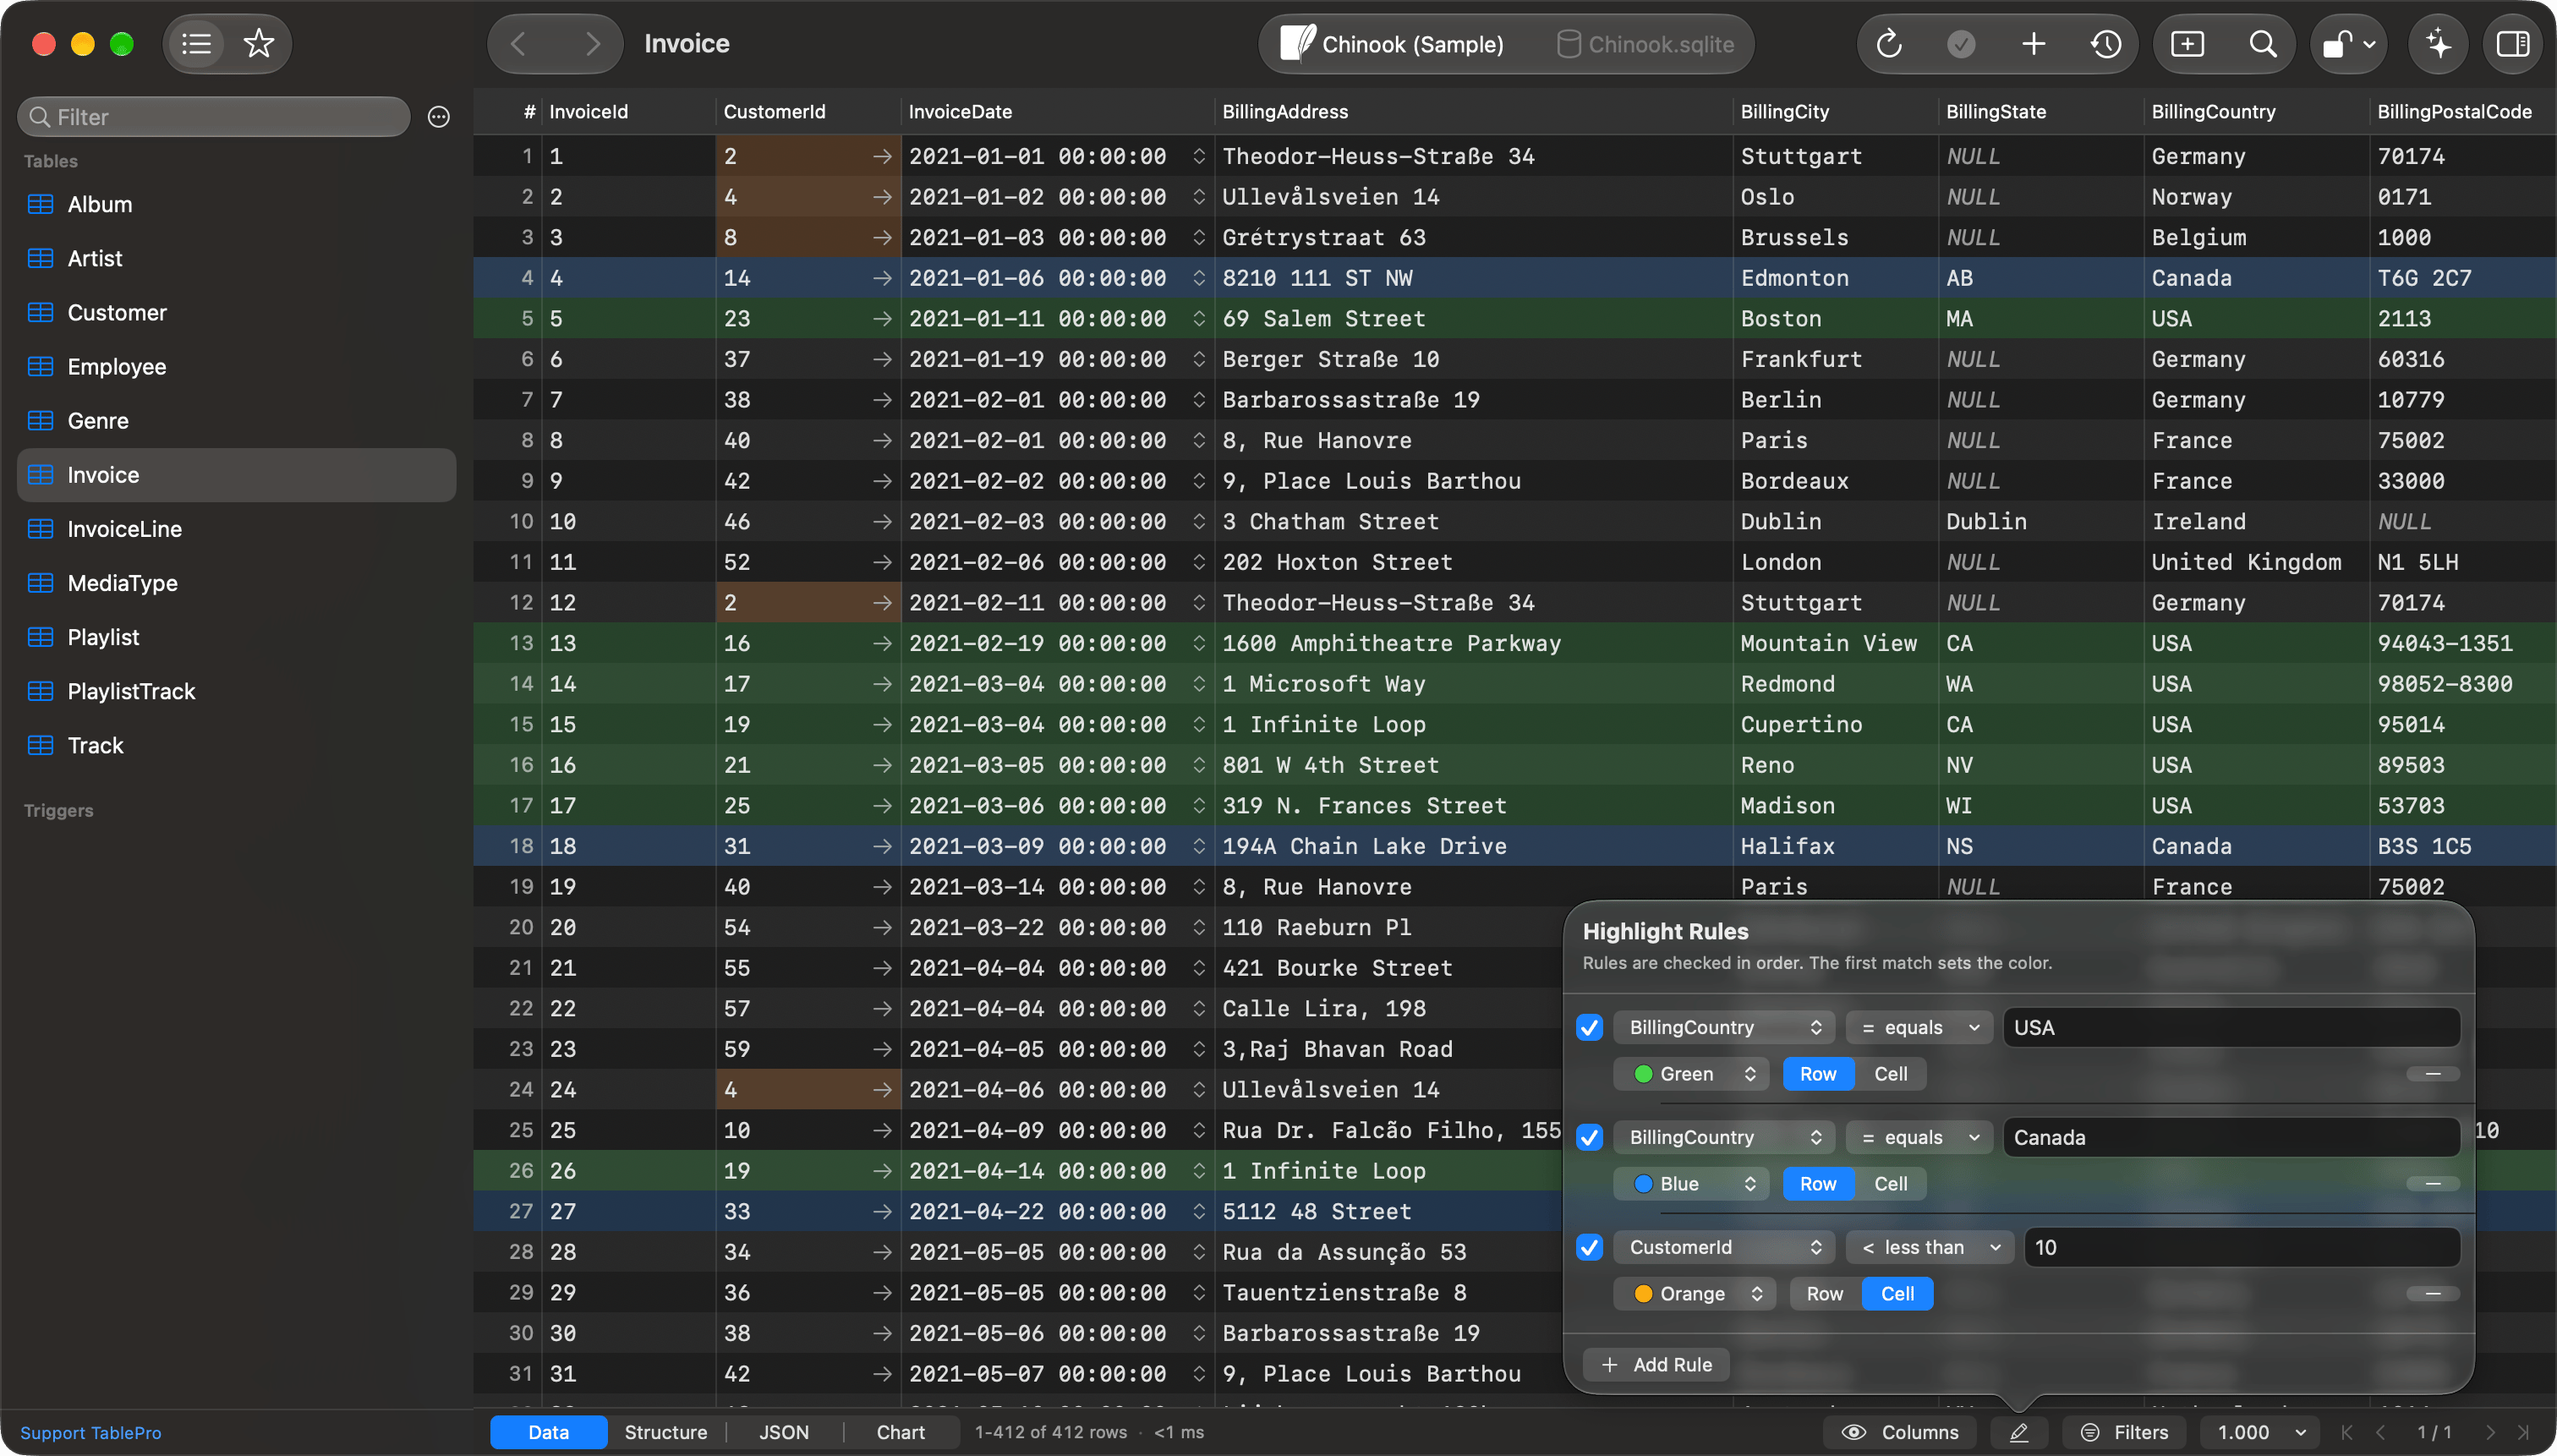 Rules run top to bottom and the first match colors the row, so drag the rule that should win to the top. A rule picked from the cell menu goes in first. A cell rule tints its own cell over the row's color. Rules read the stored value rather than the text a **Display As** format shows: a numeric column compares as numbers, a boolean column accepts `true`, `1`, `t` and `yes` alike, and `NULL` never satisfies a comparison: match it with **is NULL** or **is empty**.
A row waiting to be inserted or deleted keeps its [change tracking](/features/change-tracking) tint over any rule, and a selected row shows the selection. On a table you edit, give row rules a color other than the green and red those tints use, so a highlight never reads as a pending change.
Rules belong to the table, scoped to the connection, database, and schema, and follow the table through a rename. A query result that comes from one table uses that table's rules. Rules on any other query result are not saved, and go when the tab closes or the app quits. Saved rules stay on this Mac and do not sync.
## Columns
Drag a border to resize a column, or double-click it to fit the content; **Size to Fit** and **Size All Columns to Fit** on the header menu do the same. A fitted column stops at half the visible grid width.
Hide columns from the columns button in the status bar or from the header menu. A hidden column is not fetched, so hiding a large one makes the table load faster; the primary key and the sorted column are fetched either way. On a schemaless store the popover lists every field the grid can draw, including ones that turn up only in later documents.
Widths, order, and hidden columns are remembered per table, scoped to the connection, database, and schema; **Reset Columns** in the popover puts them back. Right-click a header and choose **Display As** to read a column's stored values in a different form; [Cell and Row Viewers](/features/json-viewer) lists the formats.
### Jump to a column
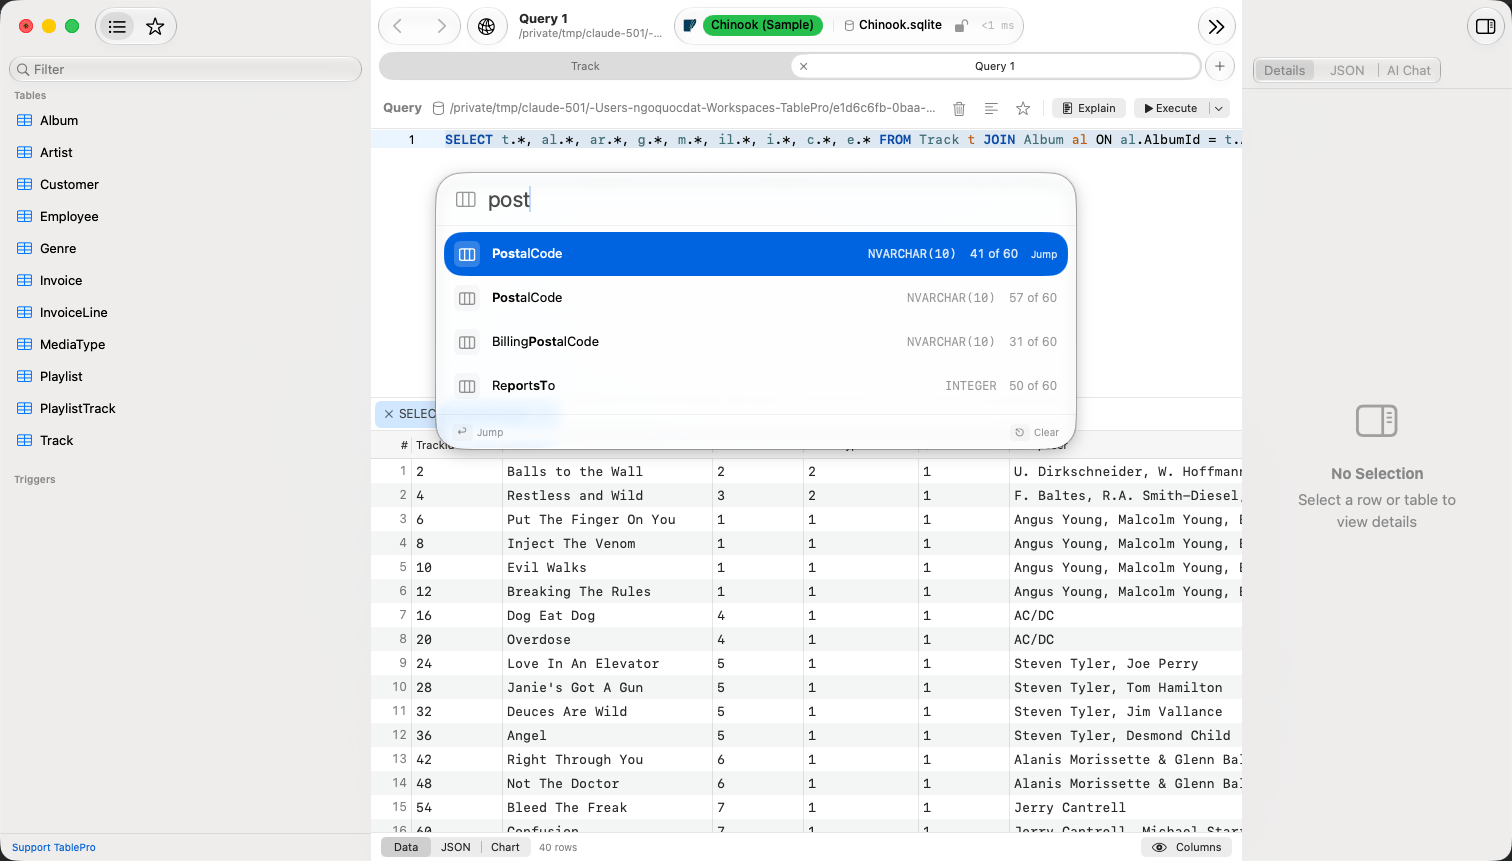
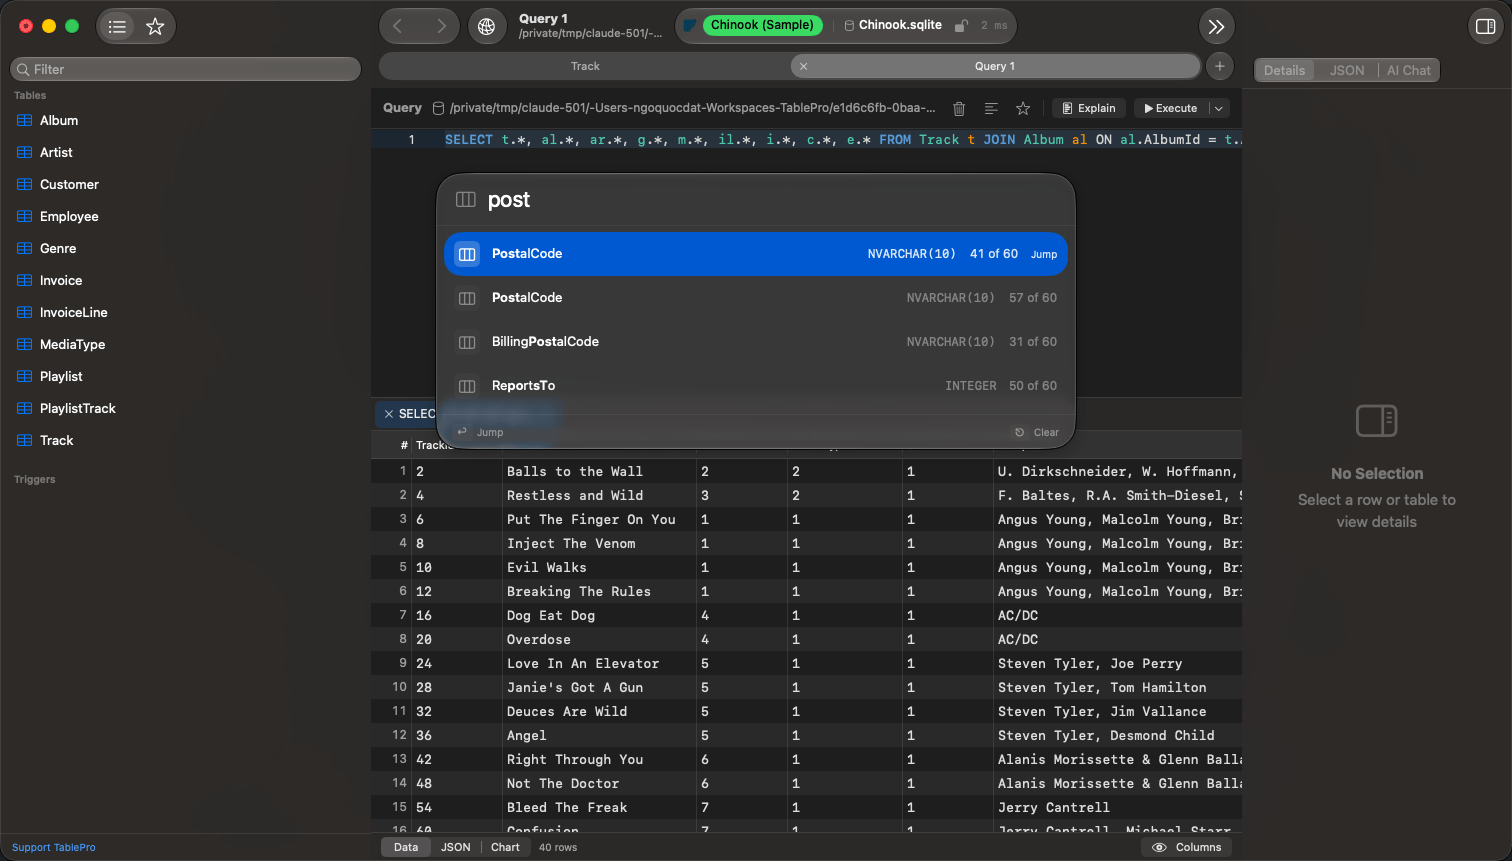
`Cmd+Shift+J`, or **Edit > Find > Jump to Column**, lists every column of the result with its type and its place in the grid. Type part of a name; matching is fuzzy, so `crat` finds `created_at`. `Return` scrolls the selected column into view and puts the cell cursor in it, on the selected row. A hidden column is listed too, marked **Hidden**, and jumping to it shows it first. **Jump to Column** at the foot of the columns popover opens the same panel with the popover's search carried over.
Rules run top to bottom and the first match colors the row, so drag the rule that should win to the top. A rule picked from the cell menu goes in first. A cell rule tints its own cell over the row's color. Rules read the stored value rather than the text a **Display As** format shows: a numeric column compares as numbers, a boolean column accepts `true`, `1`, `t` and `yes` alike, and `NULL` never satisfies a comparison: match it with **is NULL** or **is empty**.
A row waiting to be inserted or deleted keeps its [change tracking](/features/change-tracking) tint over any rule, and a selected row shows the selection. On a table you edit, give row rules a color other than the green and red those tints use, so a highlight never reads as a pending change.
Rules belong to the table, scoped to the connection, database, and schema, and follow the table through a rename. A query result that comes from one table uses that table's rules. Rules on any other query result are not saved, and go when the tab closes or the app quits. Saved rules stay on this Mac and do not sync.
## Columns
Drag a border to resize a column, or double-click it to fit the content; **Size to Fit** and **Size All Columns to Fit** on the header menu do the same. A fitted column stops at half the visible grid width.
Hide columns from the columns button in the status bar or from the header menu. A hidden column is not fetched, so hiding a large one makes the table load faster; the primary key and the sorted column are fetched either way. On a schemaless store the popover lists every field the grid can draw, including ones that turn up only in later documents.
Widths, order, and hidden columns are remembered per table, scoped to the connection, database, and schema; **Reset Columns** in the popover puts them back. Right-click a header and choose **Display As** to read a column's stored values in a different form; [Cell and Row Viewers](/features/json-viewer) lists the formats.
### Jump to a column
`Cmd+Shift+J`, or **Edit > Find > Jump to Column**, lists every column of the result with its type and its place in the grid. Type part of a name; matching is fuzzy, so `crat` finds `created_at`. `Return` scrolls the selected column into view and puts the cell cursor in it, on the selected row. A hidden column is listed too, marked **Hidden**, and jumping to it shows it first. **Jump to Column** at the foot of the columns popover opens the same panel with the popover's search carried over.
 ## Foreign keys
A foreign key cell carries an arrow on its right edge. Click it to open the referenced table filtered to the matching row, or right-click for **Preview Referenced Row**, which shows that row in a popover. The reference arrives in a tab of its own, so the rows you were reading stay open behind it. A tab already showing that same reference comes forward instead of a second one opening, and `Cmd`-click opens a new tab even then.
Clicking an arrow that points back into the table the tab already shows re-filters that tab rather than opening another. `Ctrl+Cmd+[` returns to the rows it left.
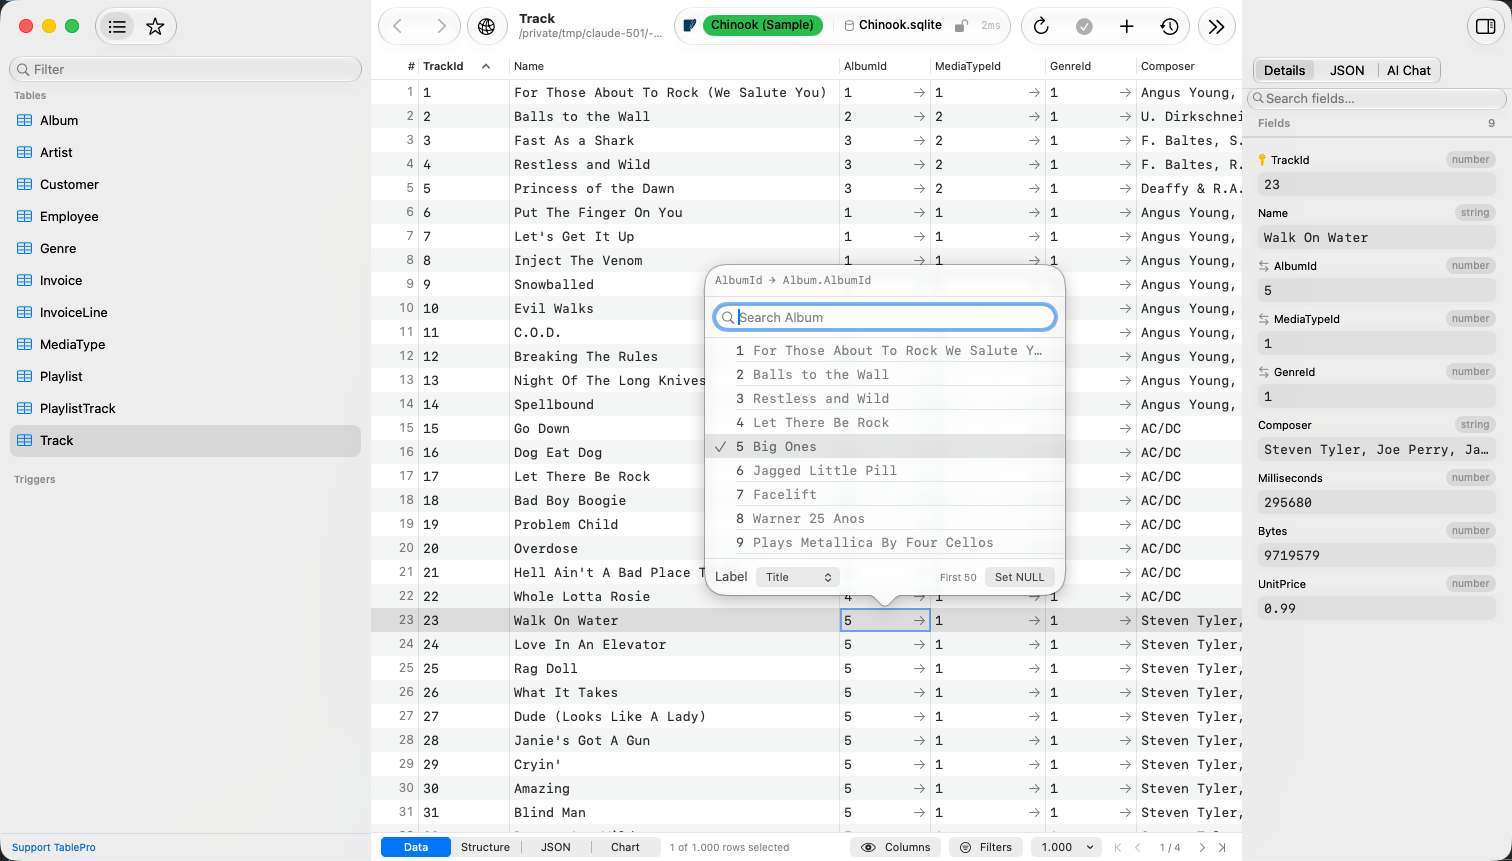
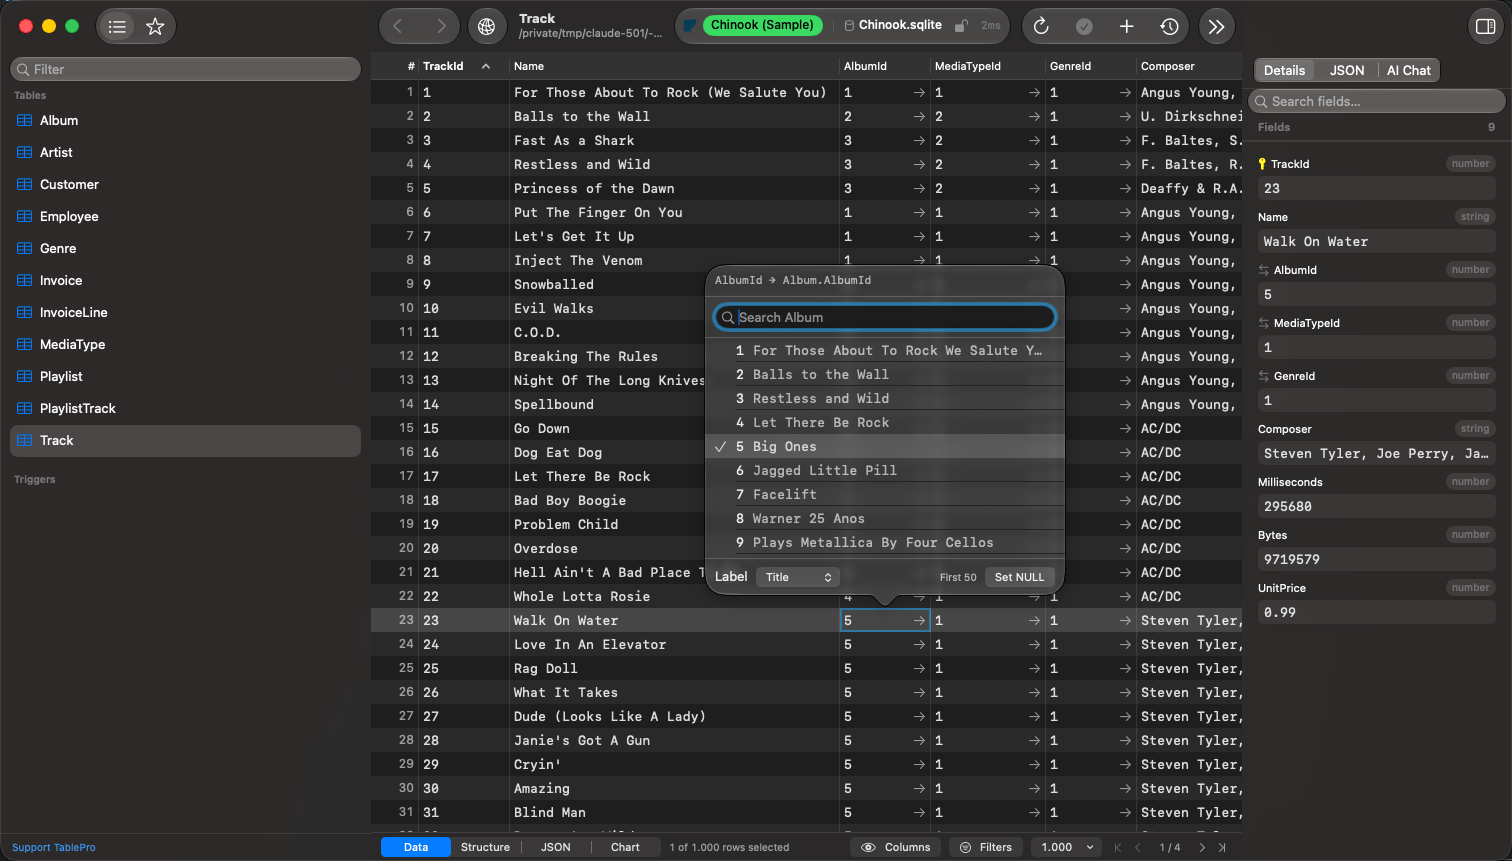
Double-click a foreign key cell, press `Return` on it, or open its right-click menu to pick the key rather than type it. The picker lists rows from the referenced table, each key with a label beside it, and narrows as you type. `Return` in the search field commits the text as typed, which covers a key the search has not turned up. **Set NULL** appears on a nullable column.
**Label** at the foot of the picker chooses the column that reads as the row's name, or **None** to list keys on their own. Either choice is remembered for the referenced table, so every column pointing at it shows the same one. A search fetches the first 50 matches, which keeps the list quick on a large table.
A column of a foreign key that spans several columns keeps the text editor. The picker sets one column, and a key it offered might not pair with the values the row holds in the constraint's other columns. Type the key, or open the referenced table and read the pair off it.
## Foreign keys
A foreign key cell carries an arrow on its right edge. Click it to open the referenced table filtered to the matching row, or right-click for **Preview Referenced Row**, which shows that row in a popover. The reference arrives in a tab of its own, so the rows you were reading stay open behind it. A tab already showing that same reference comes forward instead of a second one opening, and `Cmd`-click opens a new tab even then.
Clicking an arrow that points back into the table the tab already shows re-filters that tab rather than opening another. `Ctrl+Cmd+[` returns to the rows it left.
Double-click a foreign key cell, press `Return` on it, or open its right-click menu to pick the key rather than type it. The picker lists rows from the referenced table, each key with a label beside it, and narrows as you type. `Return` in the search field commits the text as typed, which covers a key the search has not turned up. **Set NULL** appears on a nullable column.
**Label** at the foot of the picker chooses the column that reads as the row's name, or **None** to list keys on their own. Either choice is remembered for the referenced table, so every column pointing at it shows the same one. A search fetches the first 50 matches, which keeps the list quick on a large table.
A column of a foreign key that spans several columns keeps the text editor. The picker sets one column, and a key it offered might not pair with the values the row holds in the constraint's other columns. Type the key, or open the referenced table and read the pair off it.
 The inspector's **JSON** view follows a key without leaving the row: see [Row as JSON](/features/json-viewer#row-as-json).
Step back with the Back and Forward buttons at the leading edge of the toolbar, or **View > Back** (`Ctrl+Cmd+[`) and **View > Forward** (`Ctrl+Cmd+]`). Back restores the table you came from as you left it: same filters, sort, page, and selected row. Each tab keeps its own history and Back never closes a tab. With unsaved edits in the tab, Back asks to discard them first; with a staged structure edit it stands down, because that work cannot be discarded from here.
The inspector's **JSON** view follows a key without leaving the row: see [Row as JSON](/features/json-viewer#row-as-json).
Step back with the Back and Forward buttons at the leading edge of the toolbar, or **View > Back** (`Ctrl+Cmd+[`) and **View > Forward** (`Ctrl+Cmd+]`). Back restores the table you came from as you left it: same filters, sort, page, and selected row. Each tab keeps its own history and Back never closes a tab. With unsaved edits in the tab, Back asks to discard them first; with a staged structure edit it stands down, because that work cannot be discarded from here.

 ## Inspector
Press `Cmd+Option+I`, or click the button at the trailing end of the toolbar, to open the inspector beside the grid. Its header names the table and which row of how many is selected, and a **Fields** / **JSON** control switches between two renderings of that row. [Cell and Row Viewers](/features/json-viewer) covers both. Turn on **Auto-show inspector on row select** in [Settings > Data](/customization/data-settings) to open it whenever a row is picked, in a query result as well as a table.
Short values sit on one line, label leading and value trailing. Long text, JSON, PHP, binary and images take the full width. Long text and JSON carry a resize handle; PHP, binary and images draw at a fixed height. `Tab` and `Shift+Tab` move between fields; the menu at the trailing edge of each field carries **Set NULL**, **Set DEFAULT**, **Set EMPTY** and **SQL Functions**, with `Ctrl+Option+N` and `Ctrl+Option+D` as shortcuts for the first two. Search filters the list by column name or stored value, and the pencil button narrows it to fields already edited.
With no row selected and a table open, the inspector shows that table's size, row count, engine, collation and timestamps, as far as the database reports them.
## Inspector
Press `Cmd+Option+I`, or click the button at the trailing end of the toolbar, to open the inspector beside the grid. Its header names the table and which row of how many is selected, and a **Fields** / **JSON** control switches between two renderings of that row. [Cell and Row Viewers](/features/json-viewer) covers both. Turn on **Auto-show inspector on row select** in [Settings > Data](/customization/data-settings) to open it whenever a row is picked, in a query result as well as a table.
Short values sit on one line, label leading and value trailing. Long text, JSON, PHP, binary and images take the full width. Long text and JSON carry a resize handle; PHP, binary and images draw at a fixed height. `Tab` and `Shift+Tab` move between fields; the menu at the trailing edge of each field carries **Set NULL**, **Set DEFAULT**, **Set EMPTY** and **SQL Functions**, with `Ctrl+Option+N` and `Ctrl+Option+D` as shortcuts for the first two. Search filters the list by column name or stored value, and the pencil button narrows it to fields already edited.
With no row selected and a table open, the inspector shows that table's size, row count, engine, collation and timestamps, as far as the database reports them.

 ## Find in the loaded rows
`Cmd+F` opens the find bar above the grid. `Return` and `Cmd+G` step forward, `Cmd+Shift+G` back, `Escape` clears the term and then closes the bar. Matching ignores case and accents and runs over the text as displayed; spatial columns are skipped, and so is a binary column still showing hex. The counter says which rows were searched:
| What you see | What it means |
| ---------------------- | -------------------------------------------------- |
| `3 of 12` | Every row is loaded, so this is the whole table |
| `3 of 12 on this page` | More rows exist that were never fetched |
| `No matches` | Every row is loaded and none match |
| `Not on this page` | None of the loaded rows match, and more rows exist |
**Search All Rows** turns the term into a filter that runs at the database, covering the whole table. It replaces the tab's filters, so it appears only when none are applied; with a filter set, add the term to the filter bar instead.
## Pages and row counts
A table tab pages. The status bar offers 5, 10, 20, 100, 500 or 1,000 rows per page, **Custom…** up to 1,000,000, and **All rows…**, plus First, Previous, Next and Last; `Cmd+[` and `Cmd+]` step pages, and clicking the page indicator (`3 / 12`) jumps to a page number. In a narrow window that indicator is a menu carrying **Go to page…** and the row-count choices together. The size a table opens with is a [data setting](/customization/data-settings).
A large table shows an estimated total prefixed with `~` instead of running a slow `COUNT(*)`. **Count Exactly** beside it runs the real count in the background, and `Cmd+.` cancels that. While a total is an estimate, **Last** and **All rows…** stay unavailable and **Next** works as long as the last page came back full.
A query tab does not page. It stops at the [row cap](/customization/data-settings) instead and offers **Fetch All** to load the rest, and a query carrying its own `LIMIT`, `FETCH FIRST`, or `TOP` is never capped. `Cmd+.` cancels a running query or a Fetch All.
Some engines cannot skip rows and return a fixed maximum from one query. On those, a table tab shows its leading rows only: First, Previous, Next, Last and **All rows…** are gone, the rows-per-page menu stops at the engine's maximum, and the total is counted only when you click **Count Exactly**. Filter or sort to decide which rows load. [Cloudflare R2 SQL](/databases/cloudflare-r2-sql#pagination) works this way.
## Reloading
`Cmd+R` reads the rows again and leaves the grid where it was. Scrolled down, the row at the top stays at the top, matched by primary key, so a row another session added takes its sorted place without moving what you are reading. At the top of the grid, the grid stays at the top and rows added above come into view. On a table without a primary key, or with a key that repeats, the scroll position holds instead. The selection clears.
On a table tab, sorting, filtering, and changing page or page size start at the first row. The horizontal scroll position stays.
## Copying
Click a cell to select it, drag or `Shift`-click for a range, and click a row number for a whole row. The row-number gutter stays at the left edge on a table wider than the window, so whole rows are still selectable when the columns have scrolled past it. `Shift+Space` widens whatever is selected to every row it touches. Copy acts on the whole selection.
| Shortcut | Copies |
| -------------- | --------------------------------------------- |
| `Cmd+C` | The focused cell, or the selected rows as TSV |
| `Cmd+Shift+C` | The selected rows as TSV |
| `Cmd+Option+C` | The same, with a header row |
| `Cmd+Option+J` | The selected rows as JSON |
Right-click and open **Copy as** for CSV, CSV with Headers, Markdown, and **IN Clause**, which writes `('a', 'b', 'c')` for a `WHERE col IN (…)`. **INSERT Statement(s)** and **UPDATE Statement(s)** appear when the result comes from a single table, and never on MongoDB or Redis. **Copy Column Values** on the header menu copies one column, one value per line.
Every copy follows the grid as shown: hidden columns are left out, columns keep their current order, and over a cell selection only those columns go out. UPDATE keys its `WHERE` clause on the primary key even when that cell is outside the selection.
## View modes
Switch between **Data**, **Structure**, **JSON**, **Chart**, and **Map** with the switcher at the leading edge of the status bar, or from **View > Result View**. Query tabs have no Structure mode, Map appears only while the result holds a column of drawable geometry, the mode is remembered per tab, and [Cell and Row Viewers](/features/json-viewer) covers JSON mode.
### Chart mode
Needs a [Starter license](/features/licensing).
Pick a bar, line, area, or scatter chart, then a numeric Y column. X takes row numbers, another numeric column, a date or timestamp column, or a categorical column; an optional text, boolean, enum, or set column splits the result into series. Date and timestamp columns plot on a real time axis, whatever order the rows arrive in. Hover the plot for exact values.
A chart draws the loaded rows, up to 2,000 points, 20 series, and 50,000 inspected rows, and the toolbar says when it hit one: "Showing the first 2,000 points of 8,431 loaded rows". Null, binary, and unrepresentable axis values are skipped and counted. Grid selection, Find, hidden columns, and value filters do not narrow a chart, and the page controls and **Fetch All** stay in the status bar. Chart type and axes belong to the tab and follow the column names, so they survive a page turn, a sort, and a re-run.
### Map mode
**Map** appears when a column of the result holds values the map can read. A `geometry`, `geography` or `geo_shape` column usually does, and so does a MongoDB field holding GeoJSON, which arrives typed as JSON. A result of plain columns never carries the segment, and neither does a spatial column whose values are in a format the reader does not cover.
Points, lines and polygons draw over Apple's own tiles. Nothing about the result reaches a third-party tile server. Click a shape to select its row, then switch to **Data** to see that row selected in the grid; select rows in the grid and their shapes come back highlighted. **Fit to Result** frames every drawn shape. A result with more than one geometry column gets a picker to choose between them.
Values are read as WKT, EWKT, WKB and EWKB hex, GeoJSON, ClickHouse point and ring tuples, and all six spellings of an Elasticsearch `geo_point`, so PostGIS, MySQL, MariaDB, MongoDB, Snowflake, Elasticsearch and ClickHouse draw without any setup. The map draws the rows the grid is showing, so a value filter narrows it and the page controls and **Fetch All** stay in the status bar.
The toolbar says what was drawn and what was not: `Drawing 4,102 shapes in SRID 4326. 88 rows in other coordinate systems are not drawn.` One coordinate system is drawn at a time, whichever most of the column uses.
Maps place longitude and latitude. SRID 4326, 4269 and 4979 draw directly, Web Mercator (3857, 900913, 3785, 102100, 102113) is converted, and a column carrying no SRID draws when every coordinate falls inside the range of longitude and latitude.
A projected coordinate system such as SRID 27700 or 32633 draws nothing: the pane names the SRID and asks for `ST_Transform(geom, 4326)`, which produces a result the map draws. Curved and polyhedral geometry (`CIRCULARSTRING`, `CURVEPOLYGON`, `COMPOUNDCURVE`, `MULTICURVE`, `MULTISURFACE`, `POLYHEDRALSURFACE`, `TIN`, `TRIANGLE`) is counted and named rather than drawn; `ST_CurveToLine` converts it. Latitude past 85.05 degrees flattens to that value, so Arctic and Antarctic shapes land in the wrong place.
The map is one element to VoiceOver and does not publish its shapes, so the grid stays the readable representation of spatial rows.
SQL Server, Oracle, DuckDB, SpatiaLite, Teradata, Trino, Spanner, Cassandra and BigQuery hand geometry over in formats the reader does not cover yet. Their spatial columns show text and carry no Map segment, because the segment follows what the values are rather than what the column is called.
## Editing and display
Double-click a cell to edit it. A long value stays on one line and scrolls sideways rather than wrapping into the column's width. Nothing reaches the database until you save, and [Change Tracking](/features/change-tracking) covers the type-specific editors, the row operations, and what a Save runs.
NULL renders as styled `NULL` text. That text, the date format, row height, row numbers, and alternate row backgrounds are [data settings](/customization/data-settings). Every shortcut the grid answers to, and how to rebind it, is in [Keyboard Shortcuts](/features/keyboard-shortcuts).
## Find in the loaded rows
`Cmd+F` opens the find bar above the grid. `Return` and `Cmd+G` step forward, `Cmd+Shift+G` back, `Escape` clears the term and then closes the bar. Matching ignores case and accents and runs over the text as displayed; spatial columns are skipped, and so is a binary column still showing hex. The counter says which rows were searched:
| What you see | What it means |
| ---------------------- | -------------------------------------------------- |
| `3 of 12` | Every row is loaded, so this is the whole table |
| `3 of 12 on this page` | More rows exist that were never fetched |
| `No matches` | Every row is loaded and none match |
| `Not on this page` | None of the loaded rows match, and more rows exist |
**Search All Rows** turns the term into a filter that runs at the database, covering the whole table. It replaces the tab's filters, so it appears only when none are applied; with a filter set, add the term to the filter bar instead.
## Pages and row counts
A table tab pages. The status bar offers 5, 10, 20, 100, 500 or 1,000 rows per page, **Custom…** up to 1,000,000, and **All rows…**, plus First, Previous, Next and Last; `Cmd+[` and `Cmd+]` step pages, and clicking the page indicator (`3 / 12`) jumps to a page number. In a narrow window that indicator is a menu carrying **Go to page…** and the row-count choices together. The size a table opens with is a [data setting](/customization/data-settings).
A large table shows an estimated total prefixed with `~` instead of running a slow `COUNT(*)`. **Count Exactly** beside it runs the real count in the background, and `Cmd+.` cancels that. While a total is an estimate, **Last** and **All rows…** stay unavailable and **Next** works as long as the last page came back full.
A query tab does not page. It stops at the [row cap](/customization/data-settings) instead and offers **Fetch All** to load the rest, and a query carrying its own `LIMIT`, `FETCH FIRST`, or `TOP` is never capped. `Cmd+.` cancels a running query or a Fetch All.
Some engines cannot skip rows and return a fixed maximum from one query. On those, a table tab shows its leading rows only: First, Previous, Next, Last and **All rows…** are gone, the rows-per-page menu stops at the engine's maximum, and the total is counted only when you click **Count Exactly**. Filter or sort to decide which rows load. [Cloudflare R2 SQL](/databases/cloudflare-r2-sql#pagination) works this way.
## Reloading
`Cmd+R` reads the rows again and leaves the grid where it was. Scrolled down, the row at the top stays at the top, matched by primary key, so a row another session added takes its sorted place without moving what you are reading. At the top of the grid, the grid stays at the top and rows added above come into view. On a table without a primary key, or with a key that repeats, the scroll position holds instead. The selection clears.
On a table tab, sorting, filtering, and changing page or page size start at the first row. The horizontal scroll position stays.
## Copying
Click a cell to select it, drag or `Shift`-click for a range, and click a row number for a whole row. The row-number gutter stays at the left edge on a table wider than the window, so whole rows are still selectable when the columns have scrolled past it. `Shift+Space` widens whatever is selected to every row it touches. Copy acts on the whole selection.
| Shortcut | Copies |
| -------------- | --------------------------------------------- |
| `Cmd+C` | The focused cell, or the selected rows as TSV |
| `Cmd+Shift+C` | The selected rows as TSV |
| `Cmd+Option+C` | The same, with a header row |
| `Cmd+Option+J` | The selected rows as JSON |
Right-click and open **Copy as** for CSV, CSV with Headers, Markdown, and **IN Clause**, which writes `('a', 'b', 'c')` for a `WHERE col IN (…)`. **INSERT Statement(s)** and **UPDATE Statement(s)** appear when the result comes from a single table, and never on MongoDB or Redis. **Copy Column Values** on the header menu copies one column, one value per line.
Every copy follows the grid as shown: hidden columns are left out, columns keep their current order, and over a cell selection only those columns go out. UPDATE keys its `WHERE` clause on the primary key even when that cell is outside the selection.
## View modes
Switch between **Data**, **Structure**, **JSON**, **Chart**, and **Map** with the switcher at the leading edge of the status bar, or from **View > Result View**. Query tabs have no Structure mode, Map appears only while the result holds a column of drawable geometry, the mode is remembered per tab, and [Cell and Row Viewers](/features/json-viewer) covers JSON mode.
### Chart mode
Needs a [Starter license](/features/licensing).
Pick a bar, line, area, or scatter chart, then a numeric Y column. X takes row numbers, another numeric column, a date or timestamp column, or a categorical column; an optional text, boolean, enum, or set column splits the result into series. Date and timestamp columns plot on a real time axis, whatever order the rows arrive in. Hover the plot for exact values.
A chart draws the loaded rows, up to 2,000 points, 20 series, and 50,000 inspected rows, and the toolbar says when it hit one: "Showing the first 2,000 points of 8,431 loaded rows". Null, binary, and unrepresentable axis values are skipped and counted. Grid selection, Find, hidden columns, and value filters do not narrow a chart, and the page controls and **Fetch All** stay in the status bar. Chart type and axes belong to the tab and follow the column names, so they survive a page turn, a sort, and a re-run.
### Map mode
**Map** appears when a column of the result holds values the map can read. A `geometry`, `geography` or `geo_shape` column usually does, and so does a MongoDB field holding GeoJSON, which arrives typed as JSON. A result of plain columns never carries the segment, and neither does a spatial column whose values are in a format the reader does not cover.
Points, lines and polygons draw over Apple's own tiles. Nothing about the result reaches a third-party tile server. Click a shape to select its row, then switch to **Data** to see that row selected in the grid; select rows in the grid and their shapes come back highlighted. **Fit to Result** frames every drawn shape. A result with more than one geometry column gets a picker to choose between them.
Values are read as WKT, EWKT, WKB and EWKB hex, GeoJSON, ClickHouse point and ring tuples, and all six spellings of an Elasticsearch `geo_point`, so PostGIS, MySQL, MariaDB, MongoDB, Snowflake, Elasticsearch and ClickHouse draw without any setup. The map draws the rows the grid is showing, so a value filter narrows it and the page controls and **Fetch All** stay in the status bar.
The toolbar says what was drawn and what was not: `Drawing 4,102 shapes in SRID 4326. 88 rows in other coordinate systems are not drawn.` One coordinate system is drawn at a time, whichever most of the column uses.
Maps place longitude and latitude. SRID 4326, 4269 and 4979 draw directly, Web Mercator (3857, 900913, 3785, 102100, 102113) is converted, and a column carrying no SRID draws when every coordinate falls inside the range of longitude and latitude.
A projected coordinate system such as SRID 27700 or 32633 draws nothing: the pane names the SRID and asks for `ST_Transform(geom, 4326)`, which produces a result the map draws. Curved and polyhedral geometry (`CIRCULARSTRING`, `CURVEPOLYGON`, `COMPOUNDCURVE`, `MULTICURVE`, `MULTISURFACE`, `POLYHEDRALSURFACE`, `TIN`, `TRIANGLE`) is counted and named rather than drawn; `ST_CurveToLine` converts it. Latitude past 85.05 degrees flattens to that value, so Arctic and Antarctic shapes land in the wrong place.
The map is one element to VoiceOver and does not publish its shapes, so the grid stays the readable representation of spatial rows.
SQL Server, Oracle, DuckDB, SpatiaLite, Teradata, Trino, Spanner, Cassandra and BigQuery hand geometry over in formats the reader does not cover yet. Their spatial columns show text and carry no Map segment, because the segment follows what the values are rather than what the column is called.
## Editing and display
Double-click a cell to edit it. A long value stays on one line and scrolls sideways rather than wrapping into the column's width. Nothing reaches the database until you save, and [Change Tracking](/features/change-tracking) covers the type-specific editors, the row operations, and what a Save runs.
NULL renders as styled `NULL` text. That text, the date format, row height, row numbers, and alternate row backgrounds are [data settings](/customization/data-settings). Every shortcut the grid answers to, and how to rebind it, is in [Keyboard Shortcuts](/features/keyboard-shortcuts).